I’m not a coder — I’m a designer who wanted to see what raw data could look like.
This project was my way of experimenting with creative coding using Processing. My goal wasn’t to build complex software, but to create a visual story out of NASA’s meteorite dataset. I treated each meteor strike as a graphic element and let design decisions guide the process.
Working with the Data
I downloaded the “Meteorite Landings” dataset from Kaggle (sourced from NASA). It had over 45,000 entries, each with location (latitude/longitude), mass, and some metadata. I filtered, cleaned, and worked with about 34,000 of them for clarity.
I downloaded the “Meteorite Landings” dataset from Kaggle (sourced from NASA). It had over 45,000 entries, each with location (latitude/longitude), mass, and some metadata. I filtered, cleaned, and worked with about 34,000 of them for clarity.
Processing software
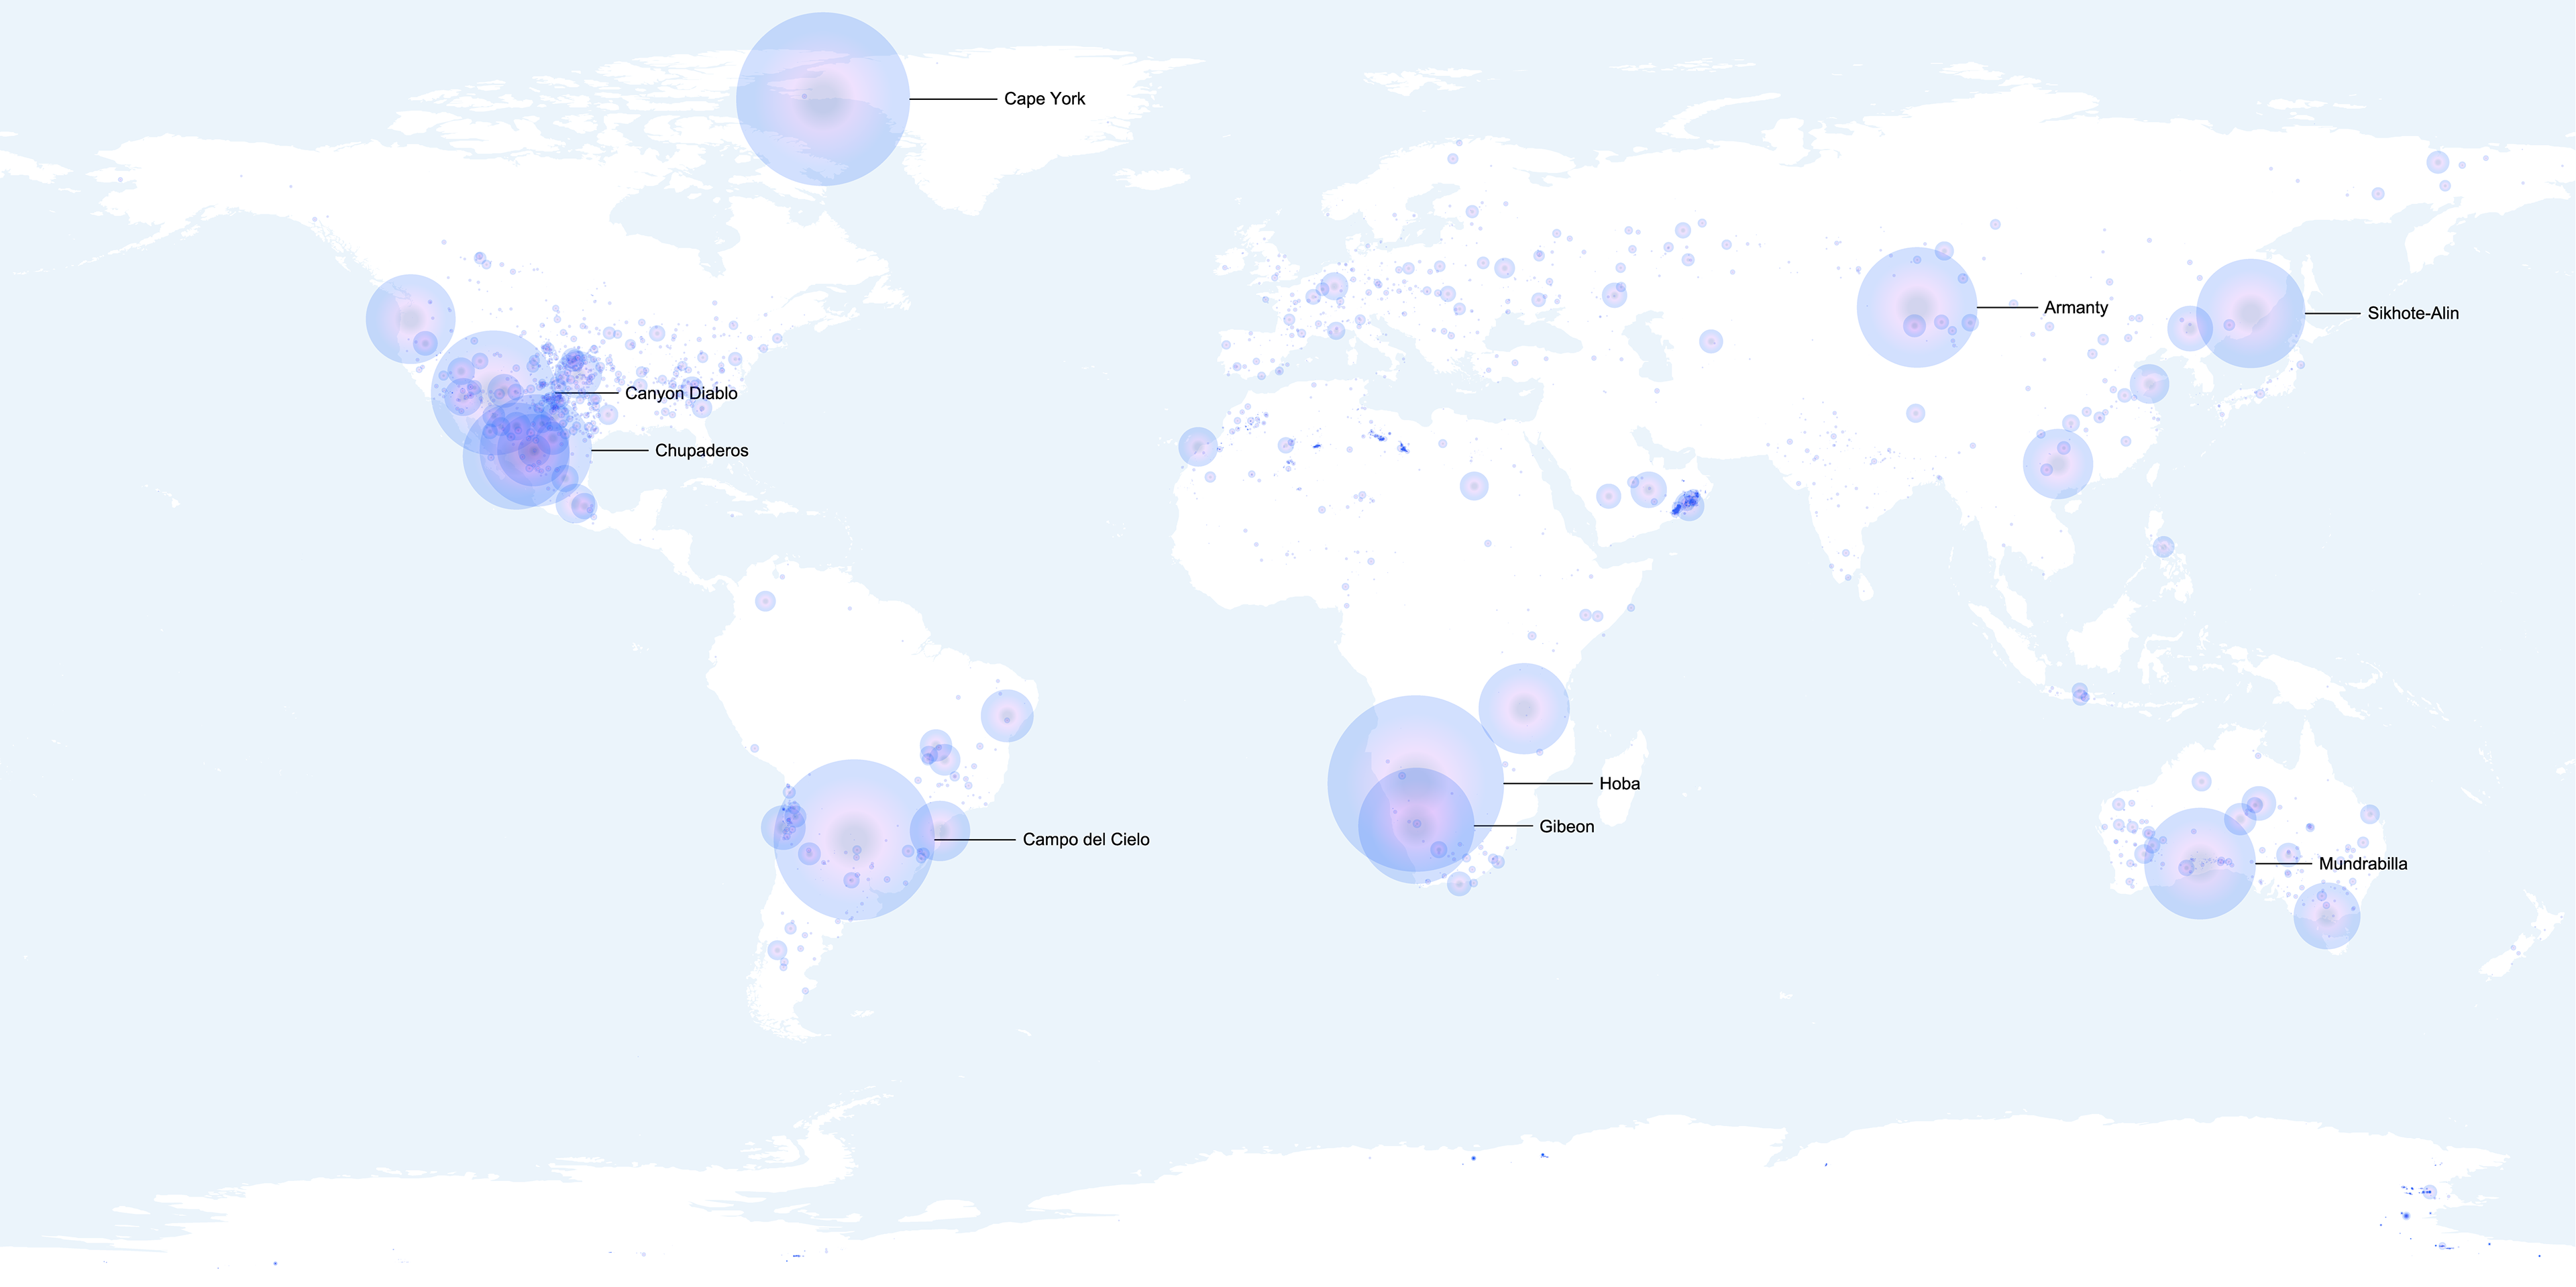
I brought the CSV into Processing and loaded the world-map SVG. Then, in one loop over all 34K meteorites, I converted each latitude/longitude into an (x,y) spot, sized a red, semi-transparent circle by its mass, and drew it on the map. Finally, I saved everything as a clean PDF. This short sketch felt more like giving design instructions than heavy coding.
Mapping the Earth
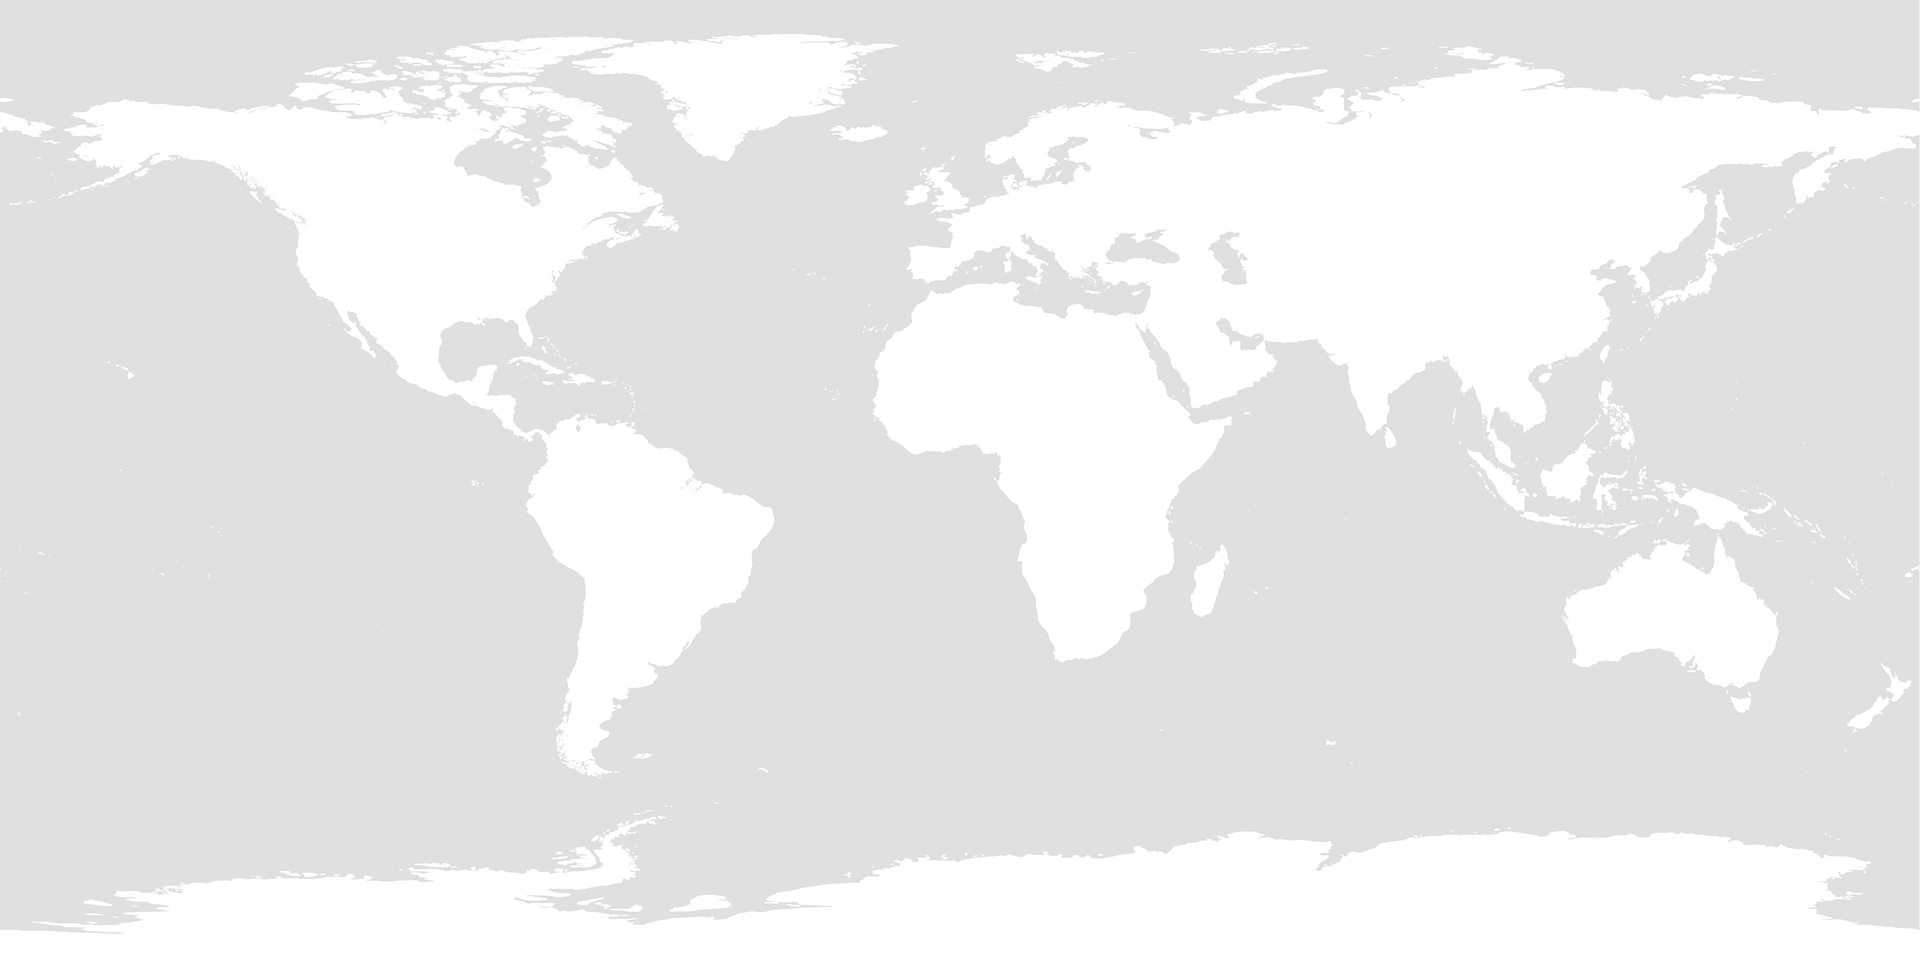
To plot the meteorites accurately, I used an equirectangular map of the world and projected each meteorite’s coordinates onto it using simple mapping functions. Longitude became x, latitude became y — that’s it. Processing made this surprisingly approachable.
To plot the meteorites accurately, I used an equirectangular map of the world and projected each meteorite’s coordinates onto it using simple mapping functions. Longitude became x, latitude became y — that’s it. Processing made this surprisingly approachable.
Why This Project Mattered
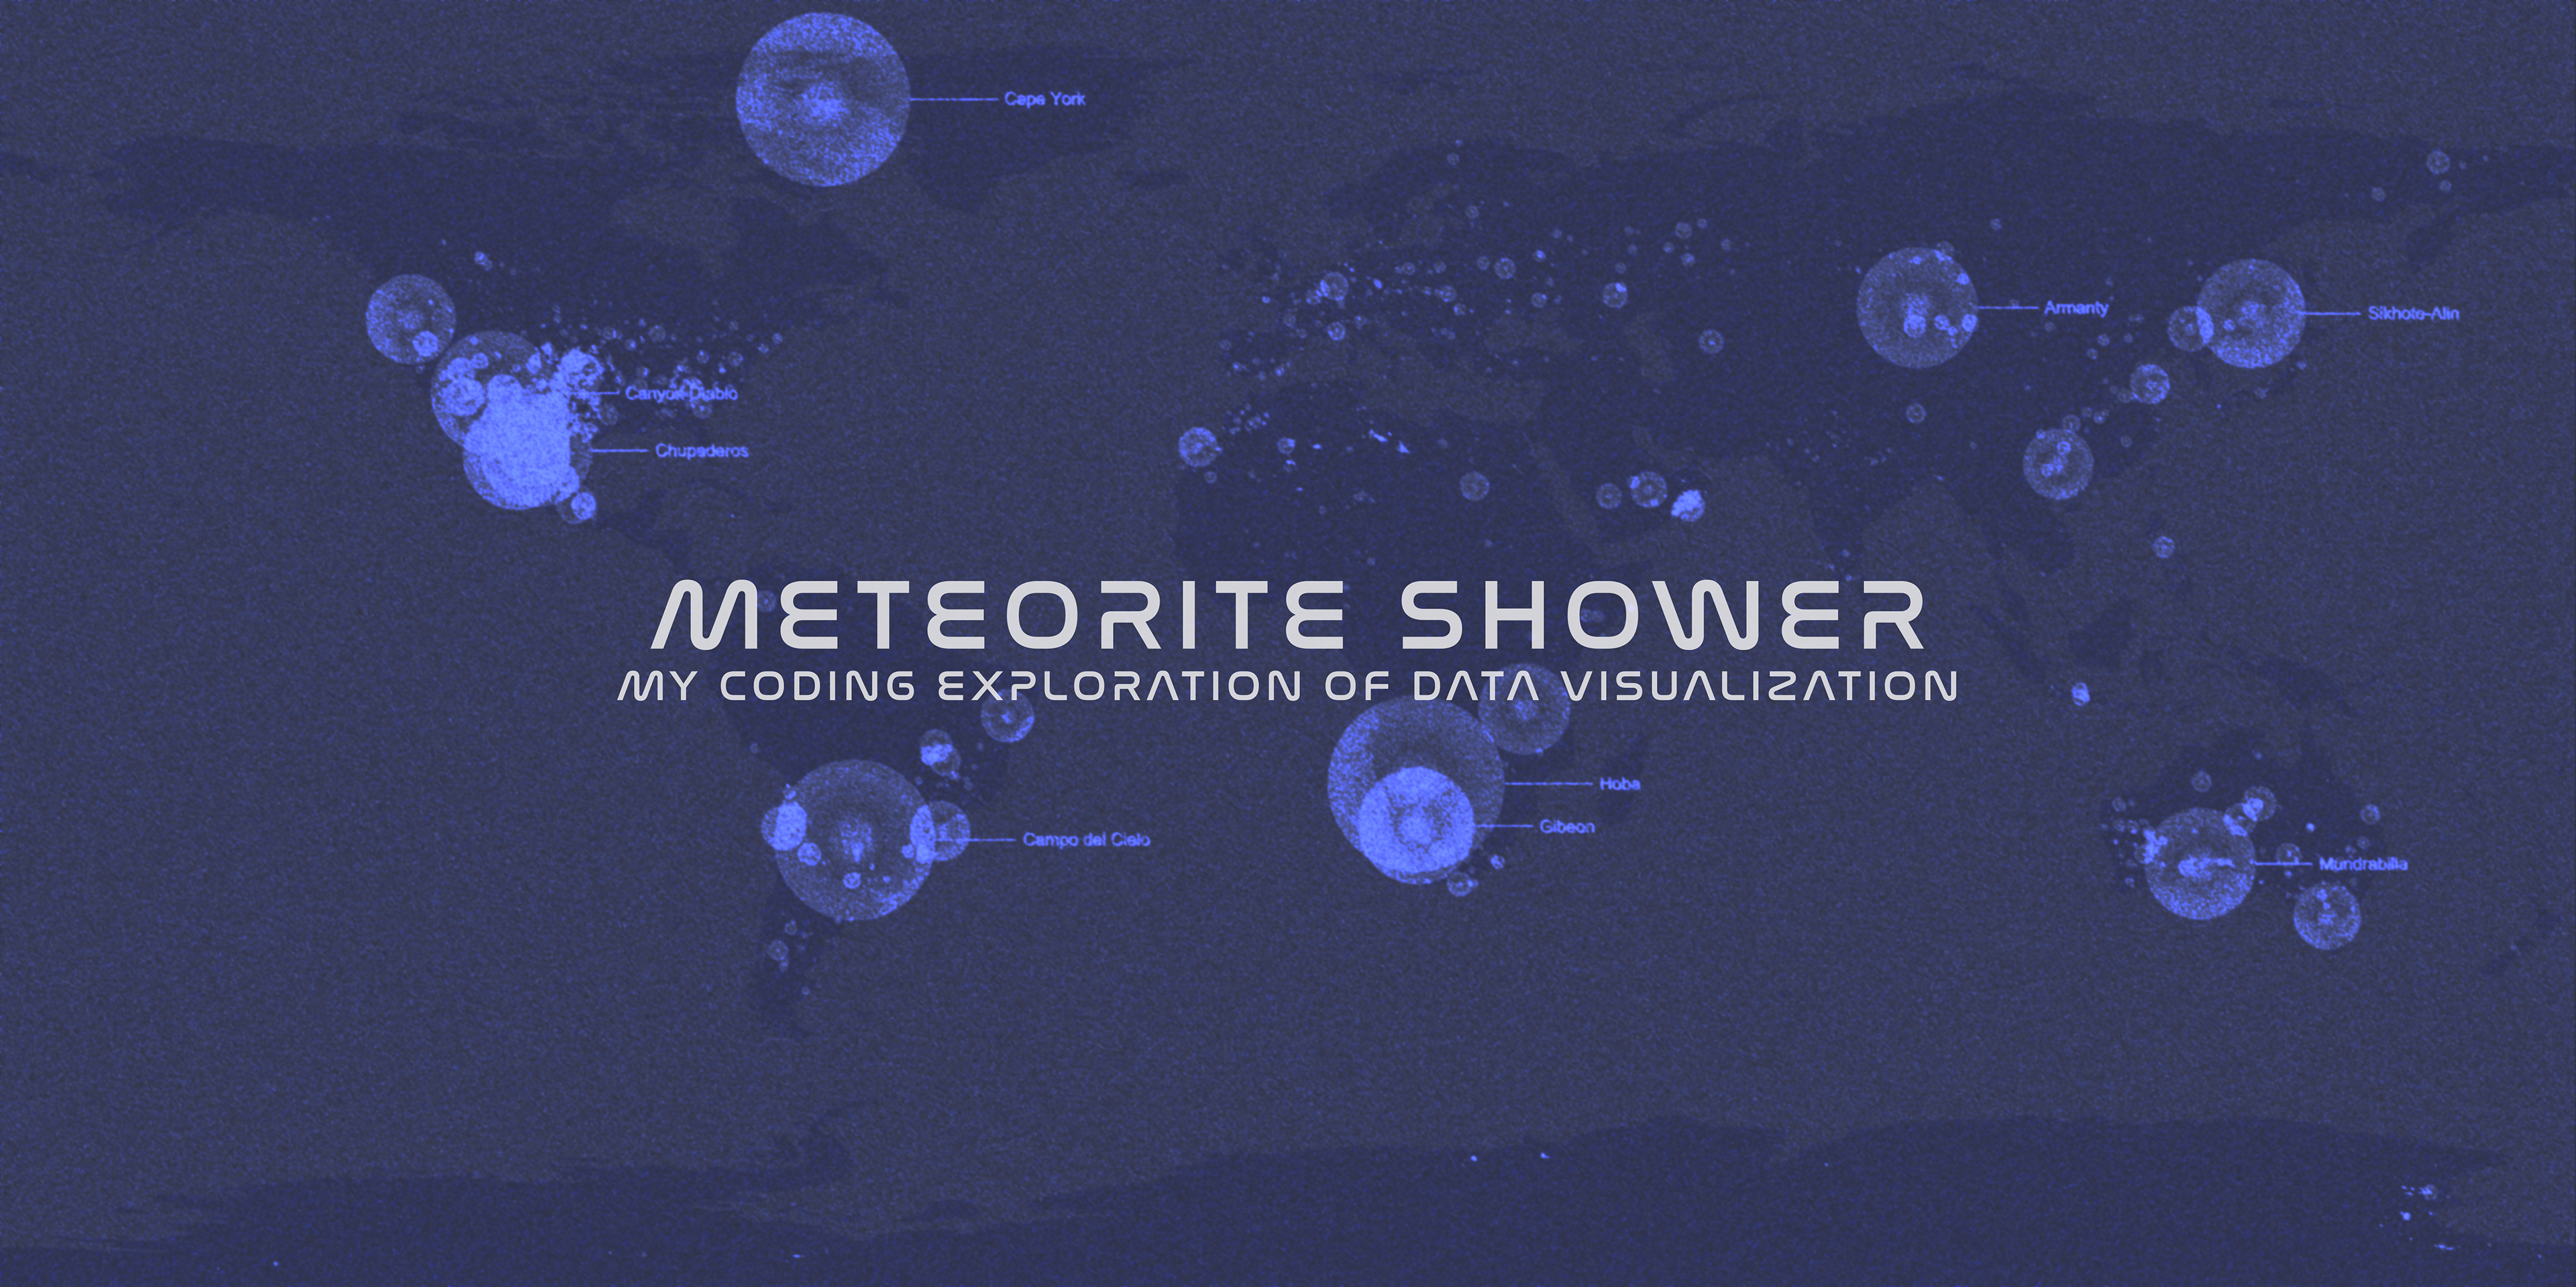
This wasn’t just about meteorites, it was about translating a huge dataset into something seeable. For me, it was a way to use design to bring numbers to life.
It was my first serious try at Processing, and while I’m not a developer, coding this sketch let me stay in charge of how the data looked, how it felt, and how people interacted with it.
It was my first serious try at Processing, and while I’m not a developer, coding this sketch let me stay in charge of how the data looked, how it felt, and how people interacted with it.